May 21, 2005
Registration maps
After last night's 2004 presidential voting maps, I thought I'd play with the voter registration data and see what kind of perspective that gives on the politics of the county. As I did with the presidential data, I stripped it down to just two categories, Republican and Democrat, as it's hard to present more categories of data in these kinds of maps.
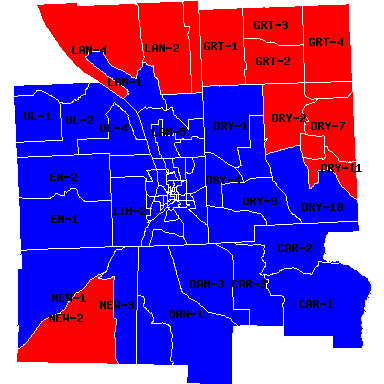
The red/blue map shows a much redder county than the presidential results, with Republicans having more registered voters than Democrats in more districts than they won in the presidential race of Dryden, Lansing, and Newfield, as well as a district in Caroline.

Red (Republican) vs. Blue (Democrat) Registrations in Tompkins County, May 2005.
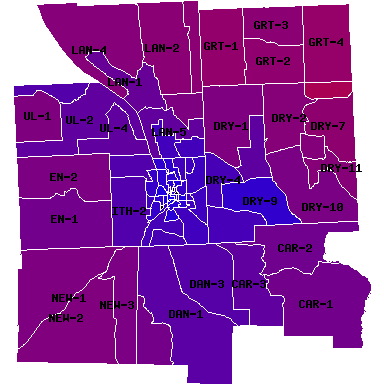
The purple registration map is similarly redder than the equivalent presidential race map was, and a bit darker because of independent and third-party voters. (I bumped up the brightness 25% because the original was very dark.)

Red (Republican) fading into Blue (Democrat) in Tompkins County, May 2005 Voter Registration.
I'm planning to do more of these maps, examining local races and changes in registration over time. There are a limited set of possibilities, but it seems to work pretty nicely.
Posted by simonstl at May 21, 2005 10:01 AMNote on photos